Mandelbrot Set
The Mandelbrot set is a famous mathematical figure that emerges when the same simple calculation is repeated millions of times. Its boundary reveals new patterns at every magnification and it is regarded as the best-known example of a fractal.
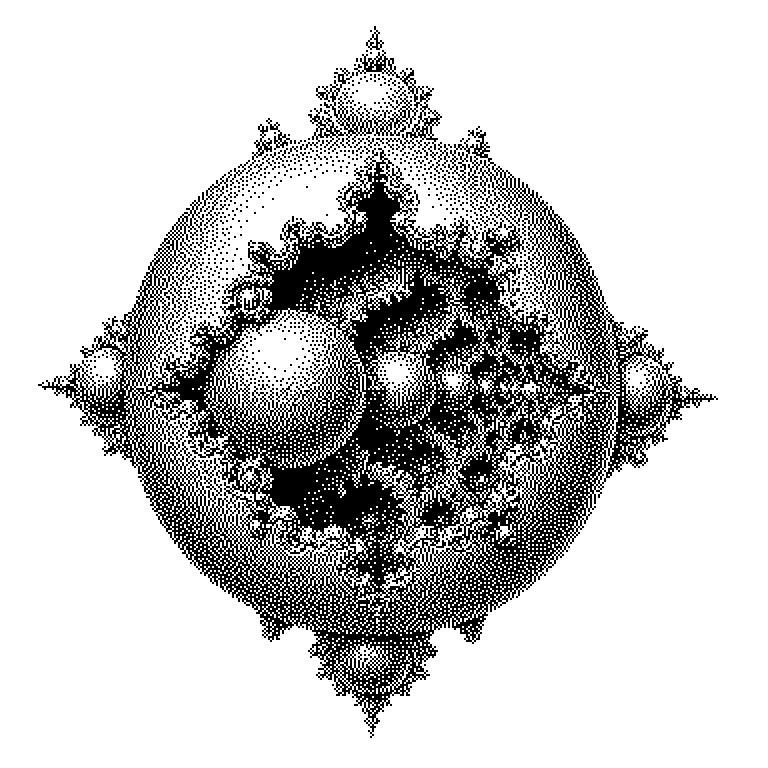
The Mandelbrot set is an image that arises from a very simple calculation rule. You take a point on a plane, plug it into a short formula, and keep recalculating the result over and over again. For some points, the results stay small and close together forever. For other points, they grow rapidly toward infinity. If you color the first group black and the second group in various colors, the typical figure emerges, with the round body and the head on top. That’s why in German it is also called 'Apfelmännchen' (little apple man). It is named after the mathematician Benoît Mandelbrot, who made it visible using computers in the 1970s.
Why a simple formula looks so complicated
The Mandelbrot set is the standard example showing that simple rules can produce complicated results. The formula behind it fits in a single line. Yet its boundary is so intricate that it cannot be fully described. This principle shows up in many areas: in weather, in traffic flows, in stock prices.
The figure is also the best-known fractal. A fractal is a shape that reveals structure again in every section, no matter how small. If you zoom into the boundary, ever new spirals, threads, and small copies of the overall figure keep appearing. This never stops. A circle, by contrast, eventually just looks like a straight line when you zoom in far enough.
For computer science, the set had a very practical value. It was one of the first images that could only be generated with a computer. No one could have carried out millions of such calculations by hand. It thus stands at the beginning of an idea that is taken for granted today: computing power makes visible things that no one could see before.
The calculation behind the little apple man
Every point on the plane represents a number. The calculation roughly works like this: take the previous result, square it, add the starting point to it. At the beginning, the result is zero. Then you repeat the step, often a hundred or a thousand times. Experts call such a repetition an iteration.
Now you observe what happens to the numbers. If they grow beyond a certain threshold, the point does not belong to the set. If they stay near the origin even after many steps, it does belong. The colorful colors in the usual images show how quickly a point escaped. Red might mean, for example: after five steps the number was too large. Blue: only after two hundred steps.
An important point is often misunderstood. The colors do not belong to the Mandelbrot set itself; they are merely a representation of the calculation duration. The actual set is the black area. Furthermore, every pixel can be calculated independently of all the others. That’s why the task is excellently suited to graphics cards, which can perform thousands of calculations simultaneously.
From poster to graphics card benchmark
Most commonly, one encounters the figure as an image: on posters, book covers, and in zoom videos that dive minutes deep into the boundary. In school, it appears in math or computer science classes, often as a small programming project. You only need a few lines of code for it.
In technology, the calculation serves as a benchmark task. Anyone wanting to test how quickly a processor or graphics card handles many similar calculations likes to generate a Mandelbrot image. The set is also mentioned as a comparison in discussions about artificial intelligence. A language model likewise consists of comparatively simple computational steps that are repeated millions of times, and yet in the end behavior emerges that no one programmed in directly.
The Mandelbrot set should be distinguished from related figures. The so-called Julia sets arise from the same formula, but they keep the additional value fixed and instead vary the starting point. Both are closely related but look different. Anyone searching the internet for fractals usually finds a mixture of both.